Welcome: Shenzhen Zhuolida Electronics Co.TD
Language:
 ∷

∷
∷
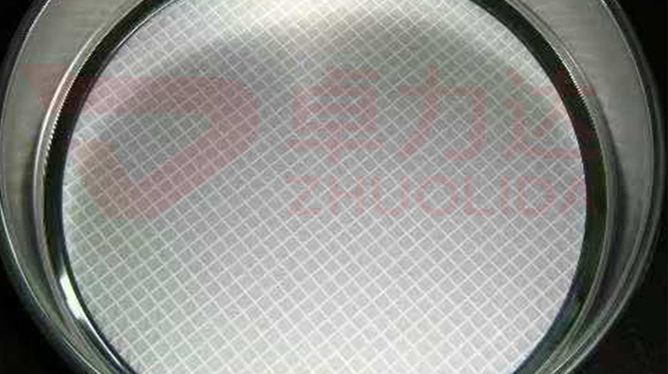
Measuring a handful of holes and finding them all in tolerance does not mean the screen will work. Semiconductor material grading is judged by the aperture distribution across hundreds of thousands of micro-holes on the whole sheet: where the mean sits, how wide the standard deviation is, whether a small cluster of holes has quietly drifted out. Electroformed screen micro-hole uniformity control governs not the size of one opening but the differences between hole and hole, between edge and centre, between this sheet and the next, and delivery is argued in distribution statistics. The ±3 μm aperture tolerance constrains every individual hole and, at the same time, the width of the whole-panel distribution. Widen that distribution and the cut-off curve blunts: particles that should be retained leak through and particles that should pass get stuck, and grading accuracy drops a band. With printing stencils you watch position and wall finish; with grading screens the first job is always to narrow the distribution.
A distribution failure looks nothing like a single out-of-size hole. On a 610×660 mm panel, a flash system samples a dozen holes at the centre and finds them all inside ±3 μm, yet the sizing run leaks at one end and clogs at the other; tally it by a three-by-three grid and the edge apertures run about 2 μm larger than the centre, the whole-panel standard deviation stretches, the outer ring leaks first while the middle clogs first. Two sheets from the same bath differ by 3 μm in mean aperture, and a customer mounting them to two machines against one specification can never align the cut points — trace it and the two hang positions saw different flow and deposition rates. More subtle still, bath circulation lags at the centre, nickel grows thinner there and the rim opens slightly larger; a spot re-check never sees it, and only a histogram across every hole on the panel exposes it. All of these pass sampling and fail distribution inspection, and only electroformed screen micro-hole uniformity control treats them as one class of problem, closing them together at exposure dose, conductive layer and flow field.
Parameter Window
• Micro-hole aperture tolerance ±3 μm, judged by whole-panel distribution statistics rather than spot sampling
• Substrates up to 610×660 mm, with edge-to-centre mean aperture converged into one band
• Minimum aperture ≥25 μm, web ≥50 μm, pitch ≥120 μm; the denser the holes, the harder the distribution is to hold
• Bath current density 1–4 A/dm²; whole-panel current spread sets thickness and aperture uniformity
• LDI resolution 8 μm/8 μm and ±5 μm double-side alignment, with panel-wide exposure-dose verification as the starting point
• Screen roundness ±0.002 mm, with hole shape and aperture distribution controlled as separate, non-substitutable metrics
Manufacturing Process (8 Steps)
1. Array design — set aperture and open area from the target particle size, and define uniform distribution as the statistical baseline.
2. Substrate pre-treatment — clean and make conductive, and verify mandrel conductive-layer thickness across the panel before the bath.
3. Lamination and LDI — imported LDI exposure at 8 μm/8 μm resolution and ±5 μm double-side alignment, with dose checked region by region.
4. Development — hold development uniformity so edge-to-centre residue differences do not leave a ring of aperture gradient.
5. Uniform-flow electroforming — shields and circulation matched to panel width, current staged at 1–4 A/dm² to compress edge-to-centre thickness spread.
6. Demolding — one-piece release, with edge thin walls neither torn nor pulled out of shape.
7. Distribution inspection — flash and vision systems sample by region and tally aperture mean, standard deviation and out-of-tolerance hole count.
8. Grading re-check — trial-sieve a standard particle-size sample, confirm the cut point, then archive with the distribution chart.
Core Advantages
1. Narrow distribution — standard deviation held inside its band gives a steep cut-off curve and no cross-grading.
2. Edge-to-centre consistency — large panels converge by region, so no outer ring of oversized holes appears on 610×660 mm sheets.
3. Interchangeable lots — mean gap between sheets from one bath minimised, so two machines on one specification need no separate calibration.
4. Fewer clogs — with no cluster of undersized holes, clogging frequency falls during continuous screening.
5. Truer grading — distribution and trial-sieve results agree, so the specification can state a real figure.
6. Traceable data — electroformed screen micro-hole uniformity control files exposure-dose maps, flow parameters and distribution histograms together.
Typical Applications
1. Semiconductor material grading, where aperture distribution sets the width of the cut point directly.
2. Pharmaceutical powder screening, where a wide distribution pushes particle size outside compliance.
3. Fine chemical filtration, where a small ring of oversized holes brings uneven flow first.
4. Precision micro-hole screens, where the distribution of ≥25 μm holes is hardest to hold.
5. Standard and calibration sieves, where whole-panel distribution is itself the acceptance basis.
6. Large-format grids, where edge-to-centre consistency on 610×660 mm sheets is the delivery challenge.
Design and Selection Notes
1. Specify by distribution. A ±3 μm tolerance alone is not enough; write mean, standard deviation and out-of-tolerance ratio into the specification together.
2. Sample on a three-by-three grid. A dozen good holes at the centre prove nothing — edges and four corners must enter the statistics.
3. Verify exposure dose region by region. LDI lamp energy falls off across panel width; without compensation it leaves a ring of aperture gradient.
4. Measure conductive-layer thickness across the panel. Strike current follows the layer, so thin spots start slow and open larger later.
5. Match shields and circulation to panel width, and beyond 1–4 A/dm² watch whole-panel current spread and bath flow rate.
6. Judge with a histogram, not a single hole. Even a few tenths of a percent of out-of-tolerance holes drag a tail onto the grading curve.
7. Run a standard particle-size trial before shipping; if distribution passes but the cut point drifts, go back to the flow field and hang position.
Seen on its own, electroformed screen micro-hole uniformity control governs the statistical behaviour of an entire panel: exposure dose gives every hole the same starting line, the conductive layer and flow field make hundreds of thousands of them grow at the same rate, and demolding keeps the finished dimensions from being pulled away. Let any one drift and the ±3 μm aperture tolerance becomes a paper figure. What is genuinely hard is not getting a few holes right, but holding a 610×660 mm panel, a dozen sheets from one bath, and several consecutive lots inside the same narrow distribution band — only then does a cut point belong in a specification. For orders with a hard grading figure, fix exposure-dose compensation, the conductive-layer thickness window and shield layout into the process card at sampling stage and run regional statistics to that card in production; it is far cheaper than retuning amplitude, swapping screens and reworking at the sizing end. On paper electroformed screen micro-hole uniformity control is a histogram and a few statistics; on the line it is simply that every part of every sheet retains the same particle band.
Contact:赖先生
Phone:+86 18938693450
Tel:0755-2708-8292
Email:yw9@zldsmt.com
Add:深圳市宝安区福永镇新和村福园一路华发工业园A3栋
 Zhuolida